
Following Donald Trump’s election, his “Drill, Baby, Drill” mantra convinced people that American producers would increase oil output, despite Trump calling for lower prices. Trump views lower oil prices as the best way to reduce inflation, which helps lower-income families who are disproportionately harmed by high energy costs. Producers welcomed the reduced red tape of drilling and infrastructure permitting. They benefited from lowered federal royalties and easier access to federal land. But they are trimming activity as lower prices squeeze cash flows.
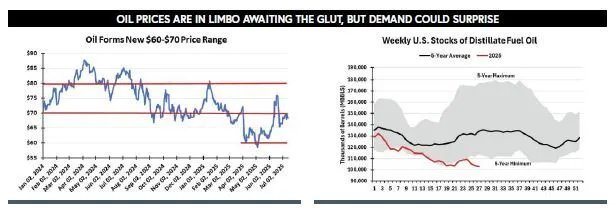
Currently, oil prices are supported by seasonal demand, as refineries crank up their output of gasoline to meet summer driving demand and distillate to meet winter home heating oil needs. However, the distillate picture is troubling for consumers (see our chart) as inventories are below the recent 5-year minimum. An early, cold winter could create problems for New England and parts of the Upper Midwest that rely on heating oil.
The domestic oil market will be challenged next year as the shutdown of two California refineries impacts the state’s and neighboring states’ gasoline supplies. Shipping more domestic refined products to California is impossible because there are no Jones Act-certified tankers available to move additional supplies from the Gulf Coast. California will need greater supplies from abroad, which will add shipping and environmental costs to the final price.
Globally, the strength of oil prices is likely to wane as OPEC+ supply increases, winter demand contracts, and Chinese oil purchases slow. This is the conventional view. It supports the current backwardation of oil futures prices (current prices are higher than future prices). Furthermore, future oil price weakness is based on the assumption that Asia-Pacific inventories will cease to grow, contributing to a greater oil oversupply than currently. But what if China’s and other Asian countries’ oil demand increases and oil producers react to the prospect of lower prices by cutting back their output? Could we experience a faster rebalancing of supply and demand?
The International Energy Agency (IEA) recently revised its historical oil demand data, adding 260,000 to 350,000 annual barrels per day to estimated demand for 2022, 2023, and 2024. This is a reminder of the difficulty in estimating global oil demand, making it imperative that forecasts based on historical data be considered as rough estimates. Therefore, the IEA’s expectation that global oil demand will peak in 2029 should be viewed with caution.
NATURAL GAS
We are in the middle of summer, so the natural gas narrative remains—heat, LNG, and storage. LNG remains stable, as foreign customers can obtain US gas at a lower cost than from any other supplier. As for domestic gas storage, despite periodic heatwaves, volumes being injected into underground caverns have climbed from near the 5-year minimum supply at the end of the first quarter of 2025 to closer to the 5-year maximum volumes. So far, the hurricane season has been slow to develop, but we are heading into the heart of the season. This means the risk of disruptions in gas supply and demand is elevated, which could prove challenging as we head toward winter.
Heat is the big story. Heat waves and heat domes periodically have gripped regions of the country. The Energy Information Administration’s natural gas report for the week ending July 10 contained some interesting data. A table in the report included heating and cooling degree days for each region of the country, as well as the national total.
It showed all regions except the West South Central and Pacific regions experienced double-digit increases over normal for the week. The four regions experiencing the largest increases above normal were New England, Middle Atlantic, and East North Central with increases of 19, 23, and 22, respectively. However, when weekly cooling degree days were measured against the same week a year ago, New England and Middle Atlantic were down 14. Only the East North Central increased. That reminds us how little we remember about the past.

Additionally, the report commented on the heat wave in the New England and Middle Atlantic regions. With temperatures in Boston reaching a high of 95ºF on July 16, the heat index at 100ºF, and planned maintenance on the Algonquin Gas Pipeline, gas prices rose by $6.81 per million British thermal units to $9.74. On July 15, prices reached a high of $13.25/MMBtu. In contrast, in the Middle Atlantic, the heat wave caused gas prices to rise by only $0.72 from $2.78 to $3.50/MMBtu.
While pipeline operators serving New York indicated constraints on their systems were a problem, the greater Middle Atlantic pipeline capacity explained the dramatically different gas price response to the heat wave. Soaring gas prices in Boston were a direct result of the limited pipeline capacity in New England compared to the Middle Atlantic and other regions. Fortunately, there were no power blackouts or heat disasters.
The US is fortunate to have such a massive pipeline network. It comprises roughly three million miles of mainline and other pipelines connecting producing basins with gas storage facilities and customers. Almost all natural gas moves through pipelines and serves nearly half the nation’s energy customers. We can thank the visionaries who built pipelines from Texas, Oklahoma, and Louisiana to the Northeast, Middle Atlantic, and Midwest regions in the 1950s and 1960s.
Heat, LNG, and storage will continue to drive the gas narrative this summer, with the added complication of hurricane season. So far, gas prices have remained at the bottom of their most recent trading range and are likely to stay there, absent some unforeseen event.
This feature appeared in ON&T Magazine’s 2025 August Edition, Lights, Camera, Action!, to read more access the magazine here.