To protect the seabed and natural habitats, we first need to understand them. Classifying the physical, geological, chemical and biological properties of the seabed provides a baseline. This can then be used to measure the impact and effectiveness of blue carbon initiatives.
Who uses seabed classification data?
Insights from the analysis of seabed classification data are helping to maintain the integrity of marine and coastal ecosystems. Many different stakeholders rely on these insights:
- Marine developers – to assess coastal and offshore habitats before construction starts, monitor the impact on local wildlife throughout the asset lifetime and take remedial action if needed. ‘Biodiversity positive’ is the ultimate goal. This is the impact on ecosystems and living things caused by projects and making sure any actions taken avoid or reduce any negative impact.
- Scientists – to support marine geological and environmental (benthic) research in areas such as marine carbon capture and much more.
- Hydrographic offices – for inclusion of information for nautical charts.
- Governments – to help map out, monitor and protect coastlines prone to erosion and plan effective defences that support the ongoing health of these coastal and marine ecosystems.
How is seabed data gathered?
We conduct seabed mapping from the coastline and hazardous shallow water to full ocean depths using a suite of hydrographic surveying technologies. We routinely use soundwaves or light to collect large amounts of bathymetry data. We also deploy multibeam, single-beam and/or side-scan sonar technologies from survey vessels, uncrewed surface vessels or remotely operated vehicles, as well as lidar technologies from light aircrafts or drones. To add value for our clients, it is common practice for us to generate seabed classification maps from the bathymetry data we collect. Here’s how it works:
- Sonar ‘backscatter’ intensity – materials on the seabed have different textures and therefore different reflectivity values. These values are visualised in a grey scale – for example, sand has a high reflective intensity so appears as it is ‘bright’ on screen (light grey), while rock has a lower reflective intensity, so appears darker (dark grey). By measuring the backscatter from the sonar data and overlaying it with our bathymetry results, we extract additional value from our survey operation.
- Lidar bathymetry reflectance – lidar technology uses light to measure reflectance. For example, seagrass is not as reflective as bright white sand, so has a lower intensity. Again, overlaying the lidar and bathymetry data provides new insights in an effective way.
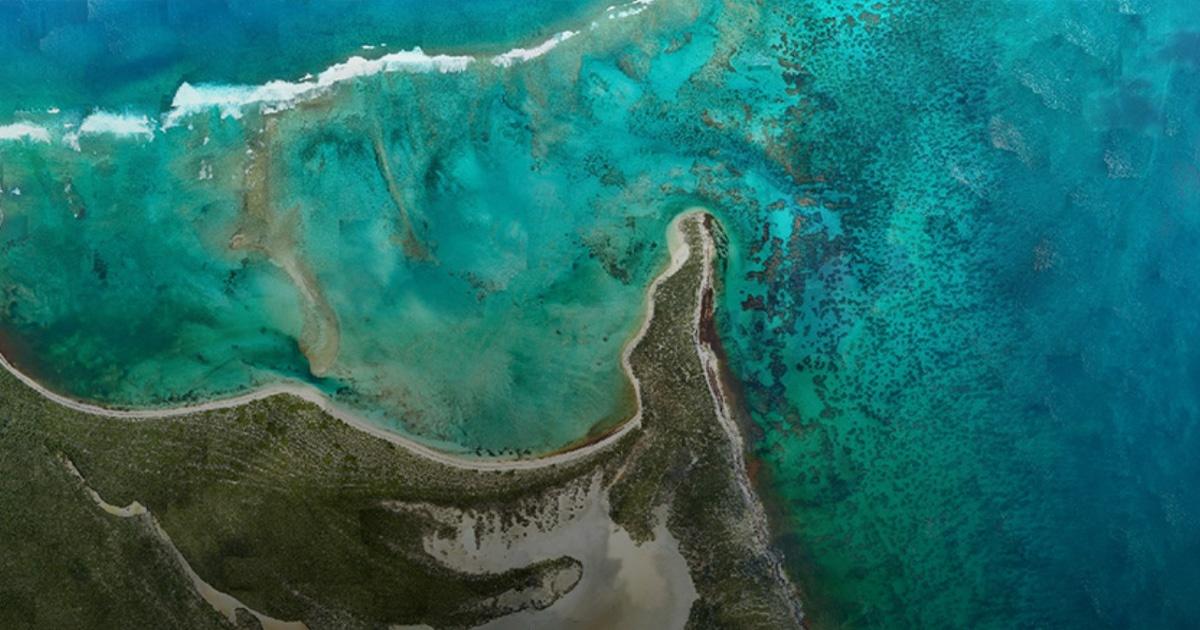
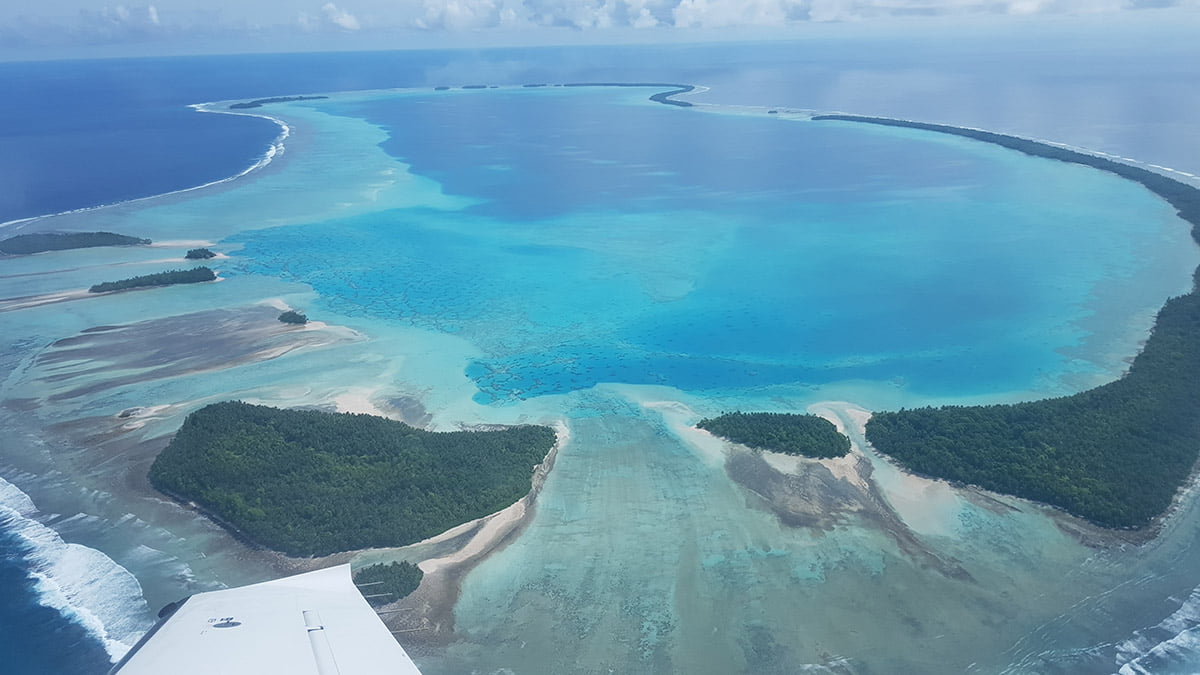 Airborne lidar capturing data over the Palau islands
How is seabed data classified?
Having analysed the backscatter images of the seafloor to identify groups with similar reflectance values, the next step is to check that different types of material (like coarse sand, crushed shells, rock and gravel) have been identified correctly. Seabed classification activities fall into two categories:
- Supervised – techniques include using a grab sampler (which brings a physical sample to the surface for inspection) or an underwater video camera (which enables a visual check to be carried out in a non-destructive way).
- Unsupervised – data libraries of reflectance values are used to group the backscatter into different classes of materials. This task can be automated or done manually.
Exciting developments on the horizon
We’ll soon be able to offer hyperspectral imaging technology to support seabed classification activities. This exciting add-on is already widely used in agriculture as a rapid, less invasive way to assess plant growth and nutrient levels in plants.
Hyperspectral technology extends beyond the visible spectrum of light to create images with an astonishingly high resolution. Using a camera fixed to a remotely operated vehicle, we’ll soon be applying hyperspectral technology to assess the health of seagrass meadows. Amazingly, the resolution is so high that it’s possible to identify a layer of bacteria on a blade of seagrass.
We plan to explore the use of hyperspectral imaging to assess the health of coral reefs and mangrove swamps too. We’ll also be looking at how to harness the power of machine learning to streamline the classification process. An exciting development on the horizon.