Used by scientists, research institutions, environmental agencies, fisheries managers, and non-government organizations in more than 70 countries, Echoview is the industry standard for transforming raw active acoustic data into powerful, meaningful results and actionable insights.
Designed for water column research, the software supports a broad range of sonar and echosounder data formats. Globally trusted, it is used across marine, freshwater, and estuarine environments for applications such as stock assessment, habitat mapping, environmental management, behavioral studies, ecosystem monitoring, and more.
Echoview 16 delivers powerful new features designed to enhance the Echoview experience with richer visuals, more precise workflows, and dynamic analysis tools.
Echoview Software’s Chief Scientist, Briony Hutton, said, “Echoview 16 combines the expertise of our programmers, quality assurance specialists, technical writers, and scientists to deliver sophisticated software. We’ve focused on making it easier to work with your data by providing clearer visuals, smoother workflows, and more capable analysis tools, so that our users can get more out of every dataset and project.”
Key Highlights of Echoview 16
Support for Humminbird and Other New Formats
Echoview is expanding compatibility with new data types and file formats, thanks to our ongoing partnerships with hardware manufacturers and the research community. Echoview 16 supports data recorded by Humminbird fish finders, including the 900/1100 series, Helix, Solix, and Apex models. New features for previously-supported formats include using pulse duration read from Lowrance *.sl3 files, and enabling depth-dependent sound speed corrections (e.g., from CTD casts) to Nortek echograms.
Conversion to ICES SONAR-netCDF4 Format
Echoview can now convert single-beam Sv, TS, angular position, GPS, and heading data into *.nc files that conform with the ICES SONAR-netCDF4 standard (version 2, type 5 equations), making it easier to share results with collaborators, archive them in a standard format, or integrate them with third-party tools.
Wideband echointegration
Echoview 16 introduces new wideband-specific echointegration analysis variables for Kongsberg EK80 data, allowing direct comparison of wideband abundance and biomass estimates with traditional narrowband echointegration approaches.
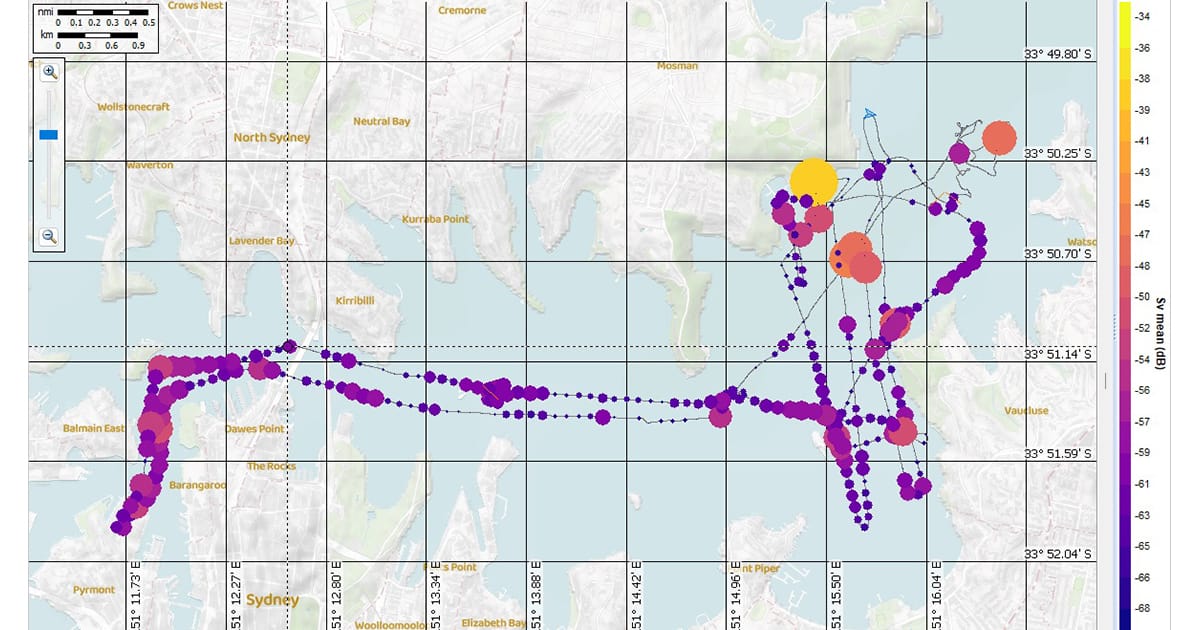
Bubble Plots and Other Alongtrack Displays
Bubble charts or proportional symbol maps let users easily map key metrics through a dynamic and intuitive update to our traditional alongtrack displays. By representing values such as NASC or fish density as bubbles on the map, users can quickly see patterns and trends that might be lost in raw numbers, explore outliers before running full analysis exports, and easily generate presentation-ready visuals.
Mapping and Time Sliders
New time sliders in cruise track windows and alongtrack displays let users focus on specific transects or time periods, making it easier to assess the context of data, especially during long surveys, overlapping transects, or isolating the exact sections of a survey. Support for Web Map Tile Service (WMTS) maps also offers more detailed, faster, and higher-quality background maps from online or custom servers.
New Interval Analysis Operators
A suite of new Interval Analysis operators makes it simple to calculate, extract, and visualize individual metrics over time. Data are analyzed in intervals (ping number, distance, or time) and result in a time series of values to graph and compare with echograms and cruise tracks.