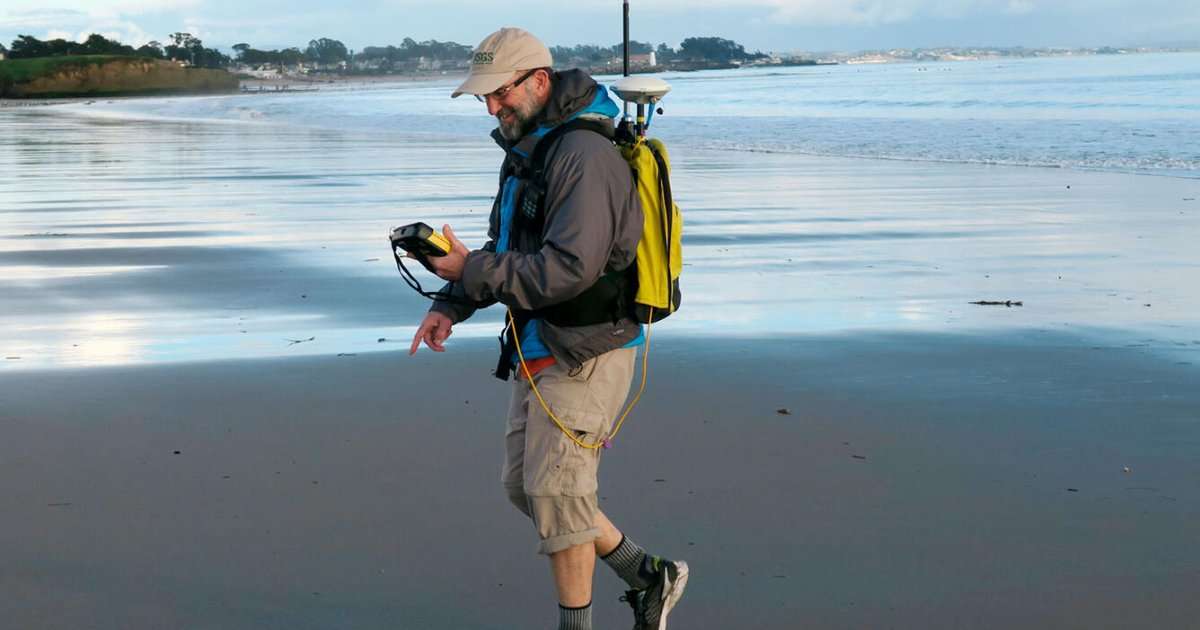
For this monitoring, a team surveys bathymetry from personal watercraft and collects beach elevation data from aerial platforms, foot surveys, and all-terrain vehicles. Combined, these data are used to create three-dimensional maps of the beach topography. They also deploy web cameras and instruments to measure water levels, currents, waves, and shoreline positions.
A long-term monitoring program at Ocean Beach near San Francisco (ongoing since 2004), is measuring shoreline change at an area that experiences some of the highest erosion rates along California’s coast. Another in Santa Barbara (from 2005 to 2024) started in response to the record 2005 flood of the Santa Clara River, providing a detailed look at how sediment injected into the nearshore has evolved over time. Long-term monitoring at the San Lorenzo River mouth in Santa Cruz has yielded important insights into how steep, coastal watersheds deliver specific types of sediment to beaches under different hydroclimatic extremes.
Shorter-term surveys, such as those taking place this fall and next spring in Ocean Beach, Santa Cruz, Santa Barbara, Ventura, and elsewhere, seek to quantify the effects of possible floods and increased wave energy associated with the pending 2026–2027 El Niño on beach conditions.
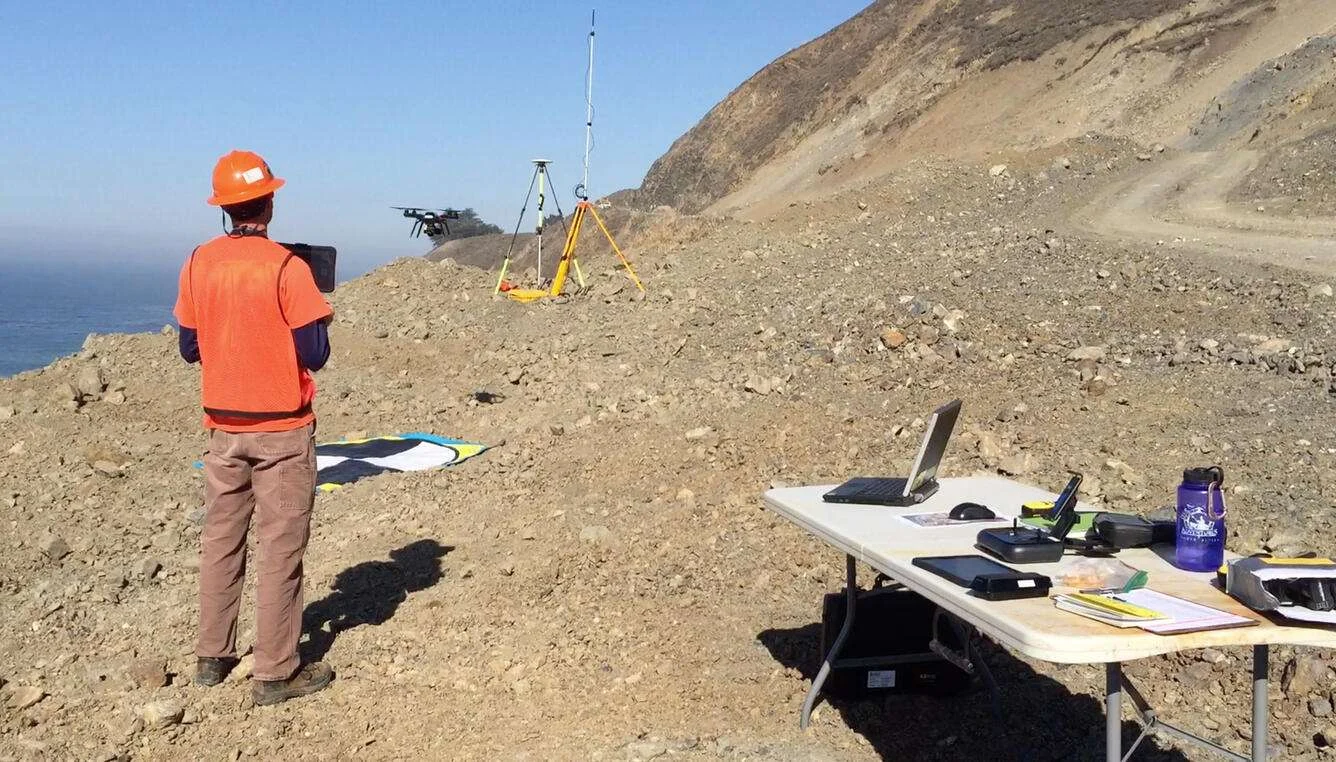
In addition to these on-the-ground surveys, the team also employs remote-sensing techniques such as satellite imagery analysis, LiDAR, and photogrammetry flights, which greatly increase the spatial coverage of the beach mapping effort.
Ultimately, this team would like to know how California’s beaches will respond to changes in sea level, wave forcing, and sediment supply. The topographic and bathymetric data are used to inform sediment management decisions and feed into coastal storm models such as the USGS Coastal Storm Modeling System (CoSMoS), which help provide a tangible picture of the future of these beaches, and the risks and vulnerabilities of erosion to California’s coastal infrastructure and habitats.
This article was originally published by USGS: https://www.usgs.gov/programs/cmhrp/news/usgs-monitors-californias-coastal-hazards-ahead-2026-2027-el-nino-event