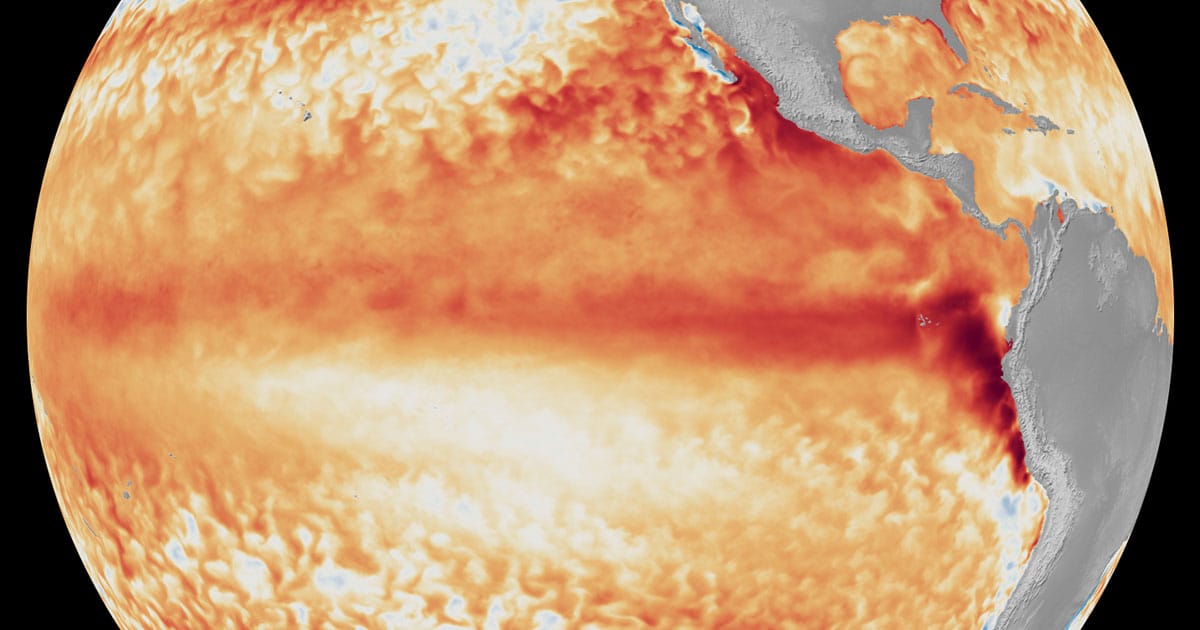
What is El Niño?
NOAA declares an El Niño (Spanish for “little boy”) has formed when temperatures in the equatorial Pacific are 0.5°C above average for several consecutive months. Additionally, NOAA monitors the atmosphere above this region of the Pacific, looking for a pattern called the Walker Circulation, a massive east-to-west air flow driven by the temperature and pressure differences between the warm western and cool eastern oceans. When the Walker Circulation breaks down, and warmer water shifts east toward South America, El Niño is declared.
What Does El Niño Mean for US Weather?
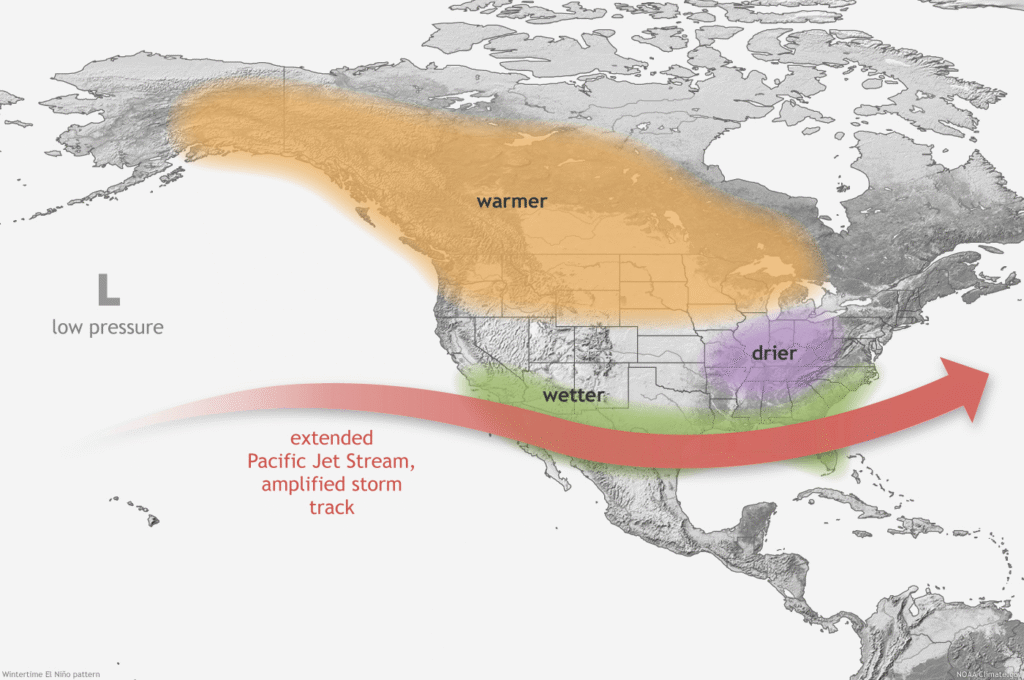
El Niño tends to be strongest during the winter months, and its global impacts are typically most significant in the Northern Hemisphere winter. During a typical El Niño winter, the jet stream over the north Pacific Ocean tends to shift southward, bringing the storm track over the southern tier of the US. The southward shift in the storm track also leads to drier conditions over the Northern Rockies and Ohio and Tennessee valleys. For temperatures, El Niño often leads to a warmer-than-usual winter over the northern US.
“Every El Niño is not the same; each one is unique with its own imprint on our weather,” said Ken Graham, Director, NOAA’s National Weather Service (NWS). “Advanced monitoring and an improved understanding of El Niño patterns allow the NWS to better predict and better prepare the public and our core partners for what is to come.”
Usual Impacts of El Niño Can Include:
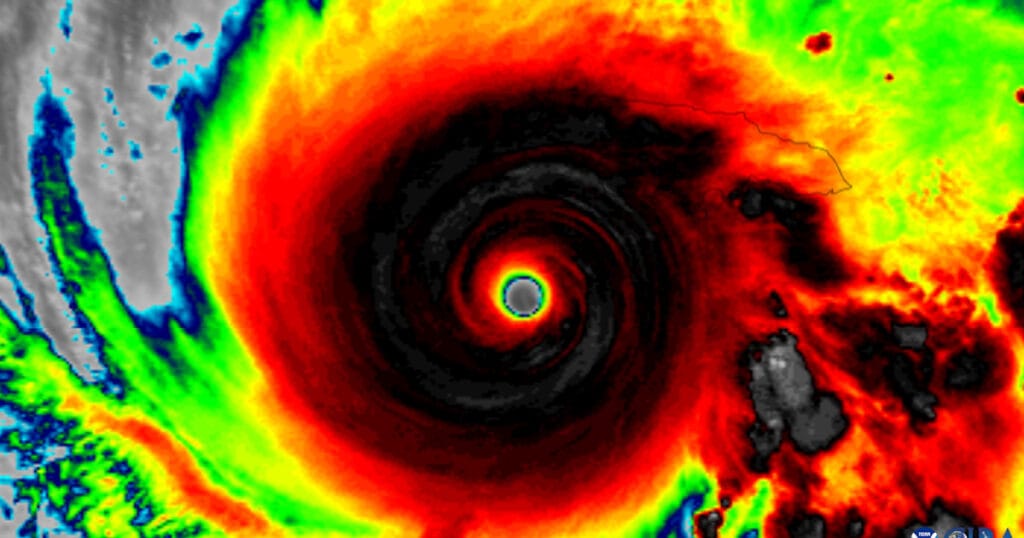
- Stronger upper-level winds that tend to suppress storm and hurricane development in the Atlantic Basin, while weaker winds tend to enhance tropical development in the eastern and central Pacific basins.
- Stormier weather is more likely in the Southern US, with chances of both rain and snow increased during El Niño winters.
- High tide flooding could become a higher risk in parts of the US, especially on the West Coast.
- Changes in the migration of fish and other oceanic organisms, with warm water species moving north while cold water species move farther north or into deeper waters. These behavioral changes impact growth, survival, and reproduction.
- Past El Niño episodes have also enhanced the formation of harmful algal blooms along the US West Coast.
A New Way of Monitoring ENSO
In February, NOAA officially adopted the Relative Oceanic Niño Index (RONI) for monitoring sea surface temperatures and forecasting El Niño and La Niña events. Whereas the traditional Oceanic Niño Index (ONI) uses a static 30-year period of recorded ocean temperatures to calculate departures from average, RONI evolves from month to month, making this index more reliable for identifying El Niño and La Niña events.
NOAA’s ENSO team has been closely monitoring both the traditional ONI and RONI since 2021. After observing several years of ENSO phases and the corresponding atmospheric response, NOAA scientists concluded that RONI more closely correlated with the expected changes in the Walker Circulation, and therefore provided more useful information about El Niño and La Niña events to weather experts, emergency managers, and the public.